Climate and Weather Charts
Francisco Sa Carneiro Airport (OPO)
(Porto, Portugal)

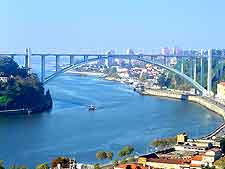
Porto features a Mediterranean climate and enjoys an enviable coastal setting, with the Atlantic Ocean influencing much of the area's annual weather, rainfall and levels of humidity. Centred around the Douro River, the city of Porto offers the perfect climate, with warm weather throughout the year.
Each of the seasons merge gently into each other in the Porto area, with temperatures often resembling a subtropical climate. Averaging 24°C / 75°F for much of this period, summer evenings in Porto can feel somewhat balmy and particularly relaxing. The average annual daytime temperatures in Porto are around 19°C / 66°F.
Climate Description: Mediterranean climate
Francisco Sa Carneiro Airport (OPO) Location: Northern Hemisphere, Portugal
Annual High / Low Daytime Temperatures at Porto: 25°C / 13°C (77°F / 55°F)
Average Daily January Temperature: 13°C / 55°F
Average Daily June Temperature: 22°C / 72°F
Annual Rainfall / Precipication Porto at Airport (OPO): 1259 mm / 50 inches
Francisco Sa Carneiro Airport (OPO):
Climate and Weather Charts
Temperature Chart |
| Temperatures |
Jan |
Feb |
Mar |
Apr |
May |
Jun |
Jul |
Aug |
Sep |
Oct |
Nov |
Dec |
Average |
Maximum
Celcius (°C) |
13 |
14 |
16 |
17 |
19 |
22 |
24 |
25 |
24 |
21 |
17 |
14 |
19 |
Minimum
Celcius (°C) |
5 |
6 |
7 |
8 |
11 |
13 |
15 |
14 |
14 |
11 |
8 |
6 |
10 |
Maximum
Fahrenheit (°F) |
55 |
57 |
61 |
63 |
66 |
72 |
75 |
77 |
75 |
70 |
63 |
57 |
66 |
Minimum
Fahrenheit (°F) |
41 |
43 |
45 |
46 |
52 |
55 |
59 |
57 |
57 |
52 |
46 |
43 |
50 |
Rainfall / Precipitation Chart |
| Rainfall |
Jan |
Feb |
Mar |
Apr |
May |
Jun |
Jul |
Aug |
Sep |
Oct |
Nov |
Dec |
Total |
| Rainfall (mm) |
163 |
142 |
124 |
112 |
89 |
51 |
20 |
25 |
66 |
145 |
165 |
157 |
1259 |
| Rainfall (inches) |
6.4 |
5.6 |
4.9 |
4.4 |
3.5 |
2.0 |
0.8 |
1.0 |
2.6 |
5.7 |
6.5 |
6.2 |
50 |
| Porto Days of Rain |
12 |
8 |
7 |
10 |
11 |
5 |
5 |
4 |
6 |
9 |
10 |
9 |
96 |
Seasonal Chart |
| Seasons |
Average
Temp
(Max °C) |
Average
Temp
(Min °C) |
Average
Temp
(Max °F) |
Average
Temp
(Min °F) |
Total
Rainfall
(mm) |
Total
Rainfall
(inches) |
| Mar to May (Spring) |
17 |
9 |
63 |
48 |
325 |
13 |
| Jun to Aug (Summer) |
24 |
14 |
75 |
57 |
96 |
4 |
| Sept to Nov (Autumn / Fall) |
21 |
11 |
69 |
52 |
376 |
15 |
| Dec to Feb (Winter) |
14 |
6 |
56 |
42 |
462 |
18 |
 Porto features a Mediterranean climate and enjoys an enviable coastal setting, with the Atlantic Ocean influencing much of the area's annual weather, rainfall and levels of humidity. Centred around the Douro River, the city of Porto offers the perfect climate, with warm weather throughout the year.